Fast Food Meals
Health vs. Cost Analysis
Introduction and User Goals
This page uses a single, consolidated dataset to compare popular fast‑food items across both nutrition and price, aimed at users who want to “optimize” their order rather than just pick based on brand loyalty or habit. The core question is how much nutrition—especially protein—you actually get for the calories and dollars you spend, and what hidden costs show up in the form of sodium, fat, and sugar. To keep the data concrete and relatable, the table focuses on well‑known flagship items from major chains (McDonald’s, Chick‑fil‑A, Chipotle, Taco Bell, Subway, Wendy’s, Burger King, and Panda Express) that a typical student or busy professional might actually order.
The rows in the table each represent one specific menu item in its standard U.S. build (no combo), such as “McDonald’s Big Mac” or “Subway Footlong Turkey Breast,” so a user can easily map the data back to items they recognize. The columns capture six key attributes: Calories (overall energy impact of the item), Protein (grams of filling, “useful” macronutrient), Sodium (mg, a major health risk when too high), Total Fat (g, including both “good” and “bad” fats in a simple total), Sugar (g, capturing the impact of buns, sauces, and glazes), and Price (approximate U.S. a‑la‑carte cost in dollars). Together, these columns balance nutritional quality and cost, allowing multi‑dimensional comparisons such as “protein per dollar,” “calories per dollar,” or “sodium per 100 calories.” The rest of the page then uses this grid as evidence to make and support concrete recommendations about smarter fast‑food choices.
Statistics Summary
- Calories
- Total energy provided by the item, measured in kilocalories.
- Protein (g)
- Grams of essential macronutrient for muscle maintenance and satiety.
- Sodium (mg)
- Milligrams of salt, which impacts blood pressure and heart health.
- Total Fat (g)
- Total grams of fat, including both healthy and unhealthy fats.
- Sugar (g)
- Grams of added or natural sugars contributing to sweetness.
- Price a la carte ($)
- Cost of the item purchased individually without a combo or meal.
Fast‑Food Nutrition Value for Cost
| Item | Calories | Protein (g) | Sodium (mg) | Total Fat (g) | Sugar (g) | Price a la carte ($) |
|---|---|---|---|---|---|---|
| McDonald’s Big Mac | 580 | 25 | 970 | 33 | 9 | 5.5 |
| McDonald’s Quarter Pounder with Cheese | 520 | 30 | 1,090 | 26 | 10 | 6 |
| Chick-fil-A Original Chicken Sandwich | 440 | 31 | 1,710 | 23 | 7 | 5.95 |
| Chick-fil-A Deluxe Chicken Sandwich | 500 | 45 | 2,300 | 35 | 9 | 10.5 |
| Chipotle Chicken Burrito (flour tortilla, white rice, black beans, chicken, cheese, sour cream, salsa) | 1,000 | 40 | 2,100 | 26 | 7 | 10.5 |
| Chipotle Chicken Bowl (same fillings, no tortilla) | 700 | 40 | 2,100 | 26 | 7 | 10.5 |
| Taco Bell Crunchy Taco (beef, standard) | 170 | 8 | 310 | 9 | 1 | 2 |
| Taco Bell Crunchwrap Supreme | 530 | 15 | 1,220 | 20 | 6 | 6.6 |
| Subway Footlong Turkey Breast | 560 | 36 | 1,640 | 7 | 14 | 9.5 |
| Subway Footlong Meatball Marinara | 960 | 40 | 2,460 | 36 | 28 | 10 |
| Wendy’s Dave’s Single | 590 | 29 | 1,080 | 37 | 8 | 6.5 |
| Wendy’s Grilled Chicken Sandwich | 370 | 33 | 1,000 | 10 | 7 | 6 |
| Burger King Whopper (no cheese) | 660 | 31 | 980 | 40 | 11 | 6.5 |
| Panda Express Orange Chicken (entrée, 1 serving) | 510 | 24 | 820 | 22 | 19 | 5.2 |
| Panda Express Broccoli Beef (entrée, 1 serving) | 150 | 9 | 520 | 7 | 5 | 5.2 |

McDonald’s Quarter Pounder Burger
Overall Patterns in the Dataset
Across all 15 items, there is a clear split between traditional burgers, fried chicken entrées, and lighter grilled or vegetable‑heavy options. Burgers and large sandwiches (Big Mac, Quarter Pounder, Dave’s Single, Whopper, Meatball Marinara Footlong, Chipotle burrito) tend to cluster in the 500–1,000 calorie range with relatively high fat and sodium, while simpler items like the Taco Bell Crunchy Taco or Panda Express Broccoli Beef entrée sit closer to 150–200 calories. At the same time, price variation is modest—many items fall between about 5 and 7 dollars—so differences in nutrition are often much larger than differences in cost.
Value and Protein Efficiency
If the user’s priority is maximizing protein per dollar, some items stand out as more efficient choices than others. The Chipotle Chicken Burrito and Bowl both provide roughly 40–45 grams of protein for around 10–10.50 dollars, yielding a strong protein‑per‑dollar ratio but also very high sodium and calories. Subway’s Footlong Turkey Breast offers about 36 grams of protein for under 10 dollars with relatively low total fat, making it a more balanced “lean protein” option than most burgers or fried chicken sandwiches. On the other hand, an item like the Taco Bell Crunchy Taco is inexpensive but only provides 8 grams of protein, so it functions better as a small add‑on than a standalone high‑protein meal.
McDonalds vs Panda Express Nutrition Comparison
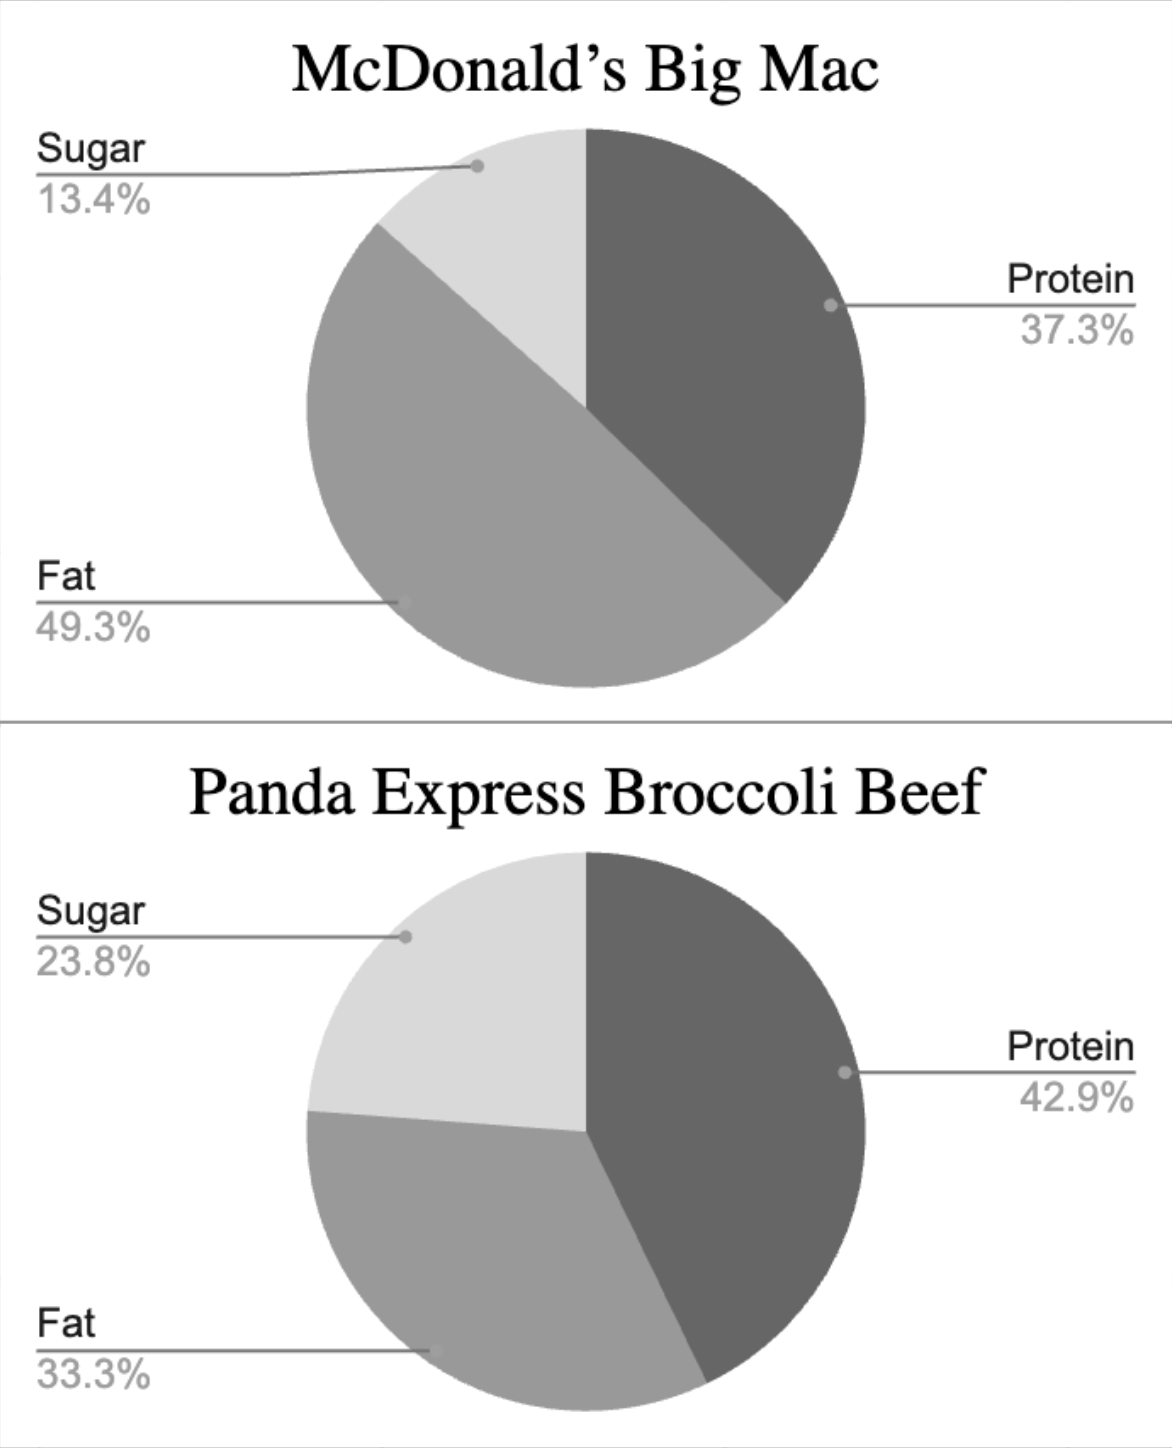
McDonald's Big Mac vs. Panada Express Broccoli Beef
These pie charts show that the Big Mac and the Panda Express Broccoli Beef entrée deliver very different “macronutrient profiles” even though both might be seen as a single main dish. In the Big Mac chart, almost half of the calories come from fat and only around a third from protein, with a smaller but still noticeable slice from sugar; that confirms the burger is a relatively high‑fat, moderate‑protein option where the bun and sauces quietly add sugar on top.
By contrast, the Broccoli Beef chart shifts more of its calories toward protein and less toward fat, with sugar still present but at a lower share than the Big Mac. That pattern reinforces the idea from the main table that stir‑fried meat‑and‑vegetable dishes can be a lighter way to get protein: you still have some oil‑based fat from the stir fry and some sugar from the sauce, but the overall balance favors protein more than in a typical fast‑food burger. For a user trying to prioritize lean protein while keeping fat and sugar in check, the visualization makes it clear why a broccoli‑and‑beef‑style entrée is a stronger choice than the Big Mac, even before looking at total calories.
Hidden costs: calories, fat, and sodium
Looking beyond price, the data shows how similar‑looking items can have very different health costs. The Subway Footlong Meatball Marinara and the Chipotle Chicken Burrito both push toward 1,000 calories, but they arrive there in different ways: the Meatball sub combines very high sodium and fat with significant sugar from the sauce and bread, whereas the Chipotle burrito concentrates calories in the tortilla, rice, and cheese. Burger classics like the Big Mac, Dave’s Single, and Whopper cluster around 580–660 calories, but each carries close to or above 1,000 mg of sodium—roughly half a typical daily limit in one item. Even some items that appear “healthier,” like the Chick‑fil‑A Original and Deluxe Chicken Sandwiches, still contain high sodium and moderate sugar from the bun and sauces.